COMPUTER SCIENCE CAFÉ
  • WORKBOOKS
  • BLOCKY GAMES
  • GCSE
    • CAMBRIDGE GCSE
  • IB
  • A LEVEL
  • LEARN TO CODE
  • ROBOTICS ENGINEERING
  • MORE
    • CLASS PROJECTS
    • Classroom Discussions
    • Useful Links
    • SUBSCRIBE
    • ABOUT US
    • CONTACT US
    • PRIVACY POLICY
  • WORKBOOKS
  • BLOCKY GAMES
  • GCSE
    • CAMBRIDGE GCSE
  • IB
  • A LEVEL
  • LEARN TO CODE
  • ROBOTICS ENGINEERING
  • MORE
    • CLASS PROJECTS
    • Classroom Discussions
    • Useful Links
    • SUBSCRIBE
    • ABOUT US
    • CONTACT US
    • PRIVACY POLICY

WEB SCIENCE | ANALYSING THE WEB

Topics from the International Baccalaureate (IB) 2014 Computer Science Guide. 
ON THIS PAGE
SECTION 1 | DIRECTED GRAPH REPRESENTATION
SECTION 2 | WEB GRAPHS AND SUB-GRAPHS
SECTION 3 | WEB GRAPH STRUCTURE
SECTION 4 | GRAPH THEORY AND CONNECTIVITY
SECTION 5 | SEARCH ENGINES AND WEB CRAWLING
​SECTION 6 | WEB DEVELOPMENT PREDICTIONS 
ALSO IN THIS SECTION
CREATING THE WEB PART 1
CREATING THE WEB PART 2​
SEARCHING THE WEB
DISTRIBUTED APPROACHES TO THE WEB
THE EVOLVING WEB
ANALYSING THE WEB
THE INTELLIGENT WEB

​NETWORK COMPONENTS
XML AND XMLT
PHP PRINCIPLES
JAVASCRIPT PRINCIPLES

REVISION CARDS
ANSWERS

Picture
TEMINOLOGY
  • Directed Graph (Digraph) | A type of graph where edges have a direction associated with them, indicating a one-way relationship between nodes.
  • Vertices (Nodes) | The individual entities in a graph, representing web pages in the context of the web graph.
  • Edges (Links) | The connections between nodes in a graph, representing hyperlinks in the web graph.
  • Web Graph | A directed graph representation of the World Wide Web, where vertices are web pages and edges are hyperlinks.
  • Sub-Graph | A smaller, defined portion of a larger graph, typically focused on a specific topic or area within the web graph.
  • Bowtie Structure | A model to describe the web graph's organisation, consisting of components like IN, SCC, OUT, Tendrils, and Tubes.
  • Strongly Connected Component (SCC) | A subset of a directed graph where there is a path from every node to every other node within the subset.
  • Diameter | In graph theory, the longest of all the shortest paths between any pair of nodes in a graph.
  • Graph Theory | A field of mathematics and computer science focusing on the study of graphs and their properties.
  • Connectivity | In graph theory, a measure of how well-connected the vertices of a graph are.
  • PageRank Algorithm | An algorithm used by Google Search to rank web pages in their search engine results, based on the number and quality of links to the pages.
  • Web Crawling | The process by which search engines browse the web systematically to index the content of web pages.
  • Scale-Free Network | A type of network characterised by the power-law distribution of connections per node, often used to describe the web.
  • Power Laws | Mathematical relationships where one quantity varies as a power of another, often observed in the distribution of web properties like links.
  • IN Component | In the bowtie structure of the web, the set of pages that can reach the SCC but cannot be reached from it.
  • OUT Component | In the bowtie structure, the set of pages that can be reached from the SCC but do not link back to it.
  • Tendrils | In the bowtie structure, pages not in IN, OUT, or SCC, but connected to IN or OUT through one-way links.
  • Tubes | Direct connections in the bowtie structure of the web that bridge IN and OUT components without passing through the SCC.
  • Disconnected Components | In the bowtie structure, pages completely isolated from the main interconnected structure of the web.
SECTION 1 | DIRECTED GRAPH REPRESENTATION
Imagine the World Wide Web as a map of connected pages. Using graph theory, we analyze how these pages link together. SECTION 1 - Directed Graph Representation The World Wide Web is a huge network of pages connected by hyperlinks. This can be represented as a directed graph, where: Nodes are web pages. Edges are hyperlinks, showing one-way connections. Hyperlinks act like one-way streets. You can navigate from Page A to Page B, but there may not be a direct way back. This one-way connection is a key feature of the web. The web graph is incomplete. Not all pages are linked to each other. Some pages have thousands of links, while others have very few. SECTION 2 - Key Features of the Web Graph The web graph has three unique traits: Scale-Free - A small number of pages have many links, while most pages have very few. Small-World - Despite its size, any page is just a few clicks away from another. Dynamic - The web changes constantly, with pages and links being added or removed. Understanding this structure helps us study navigation and build better search engines. SECTION 3 - Sub-Graphs Sub-graphs are smaller parts of the web graph focused on specific topics. For example: A sub-graph could represent pages about climate change. These smaller graphs are easier to analyze and show how information spreads within a topic. SECTION 4 - Web Graph Structure The web graph follows a bowtie model: Core: Pages that all link to each other. IN: Pages that link to the core but are not linked back. OUT: Pages that can be reached from the core but do not link back to it. Disconnected: Isolated pages not linked to the main graph. This structure shows the interconnected and fragmented nature of the web. SECTION 5 - Search Engines Search engines use web graphs to work. Crawlers map pages and links, creating an index of the web. Google’s PageRank algorithm ranks pages based on the number and quality of links. Pages with more important links rank higher. Conclusion Web graphs simplify how we understand the internet. They show us how pages are connected, help search engines rank content, and predict how the web might evolve in the future.
The World Wide Web, a vast and intricate network of interconnected web pages, can be effectively represented and understood through the lens of graph theory, particularly as a directed graph. This representation provides a foundational framework for analysing the structure and behaviour of the web, offering insights into web navigation, search engine algorithms, and the overall architecture of the internet.

What is a Directed Graph?
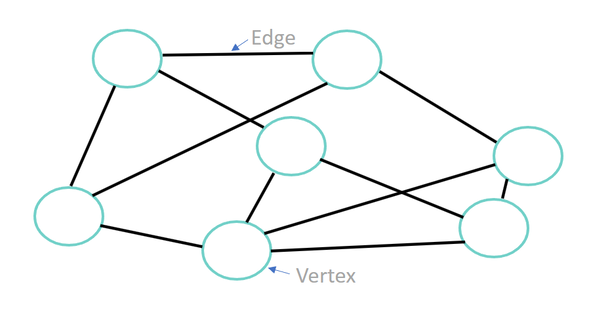
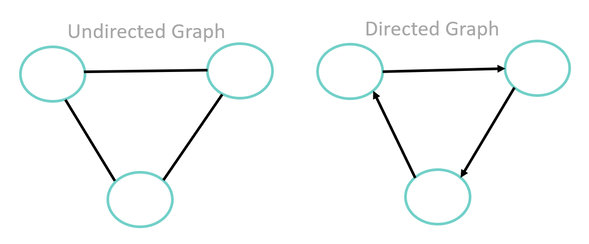
A directed graph, or digraph, is a collection of nodes (or vertices) connected by edges, where each edge has a direction associated with it. In the context of the web, these nodes represent individual web pages, and the directed edges symbolize the hyperlinks that connect one page to another. Unlike in an undirected graph, where edges imply a two-way relationship, the directed edges in a digraph capture the asymmetry of web navigation – you can follow a link from page A to page B without necessarily having a direct link back from B to A.

The Web as a Directed Graph: The Web Graph
Vertices (Nodes) as Web Pages
In the web graph, each vertex represents a unique web page. These pages can vary widely in content, ranging from text and images to interactive multimedia. The sheer number of these vertices reflects the vastness of the web, with each page being a distinct entity within the network.

Edges as Hyperlinks
The edges in the web graph are the hyperlinks that connect one web page to another. These are directed edges because a hyperlink provides a one-way connection from the source page to the destination page. This directionality is crucial as it defines the pathway of user navigation and the flow of information across the web.

Not a Complete Graph
It's important to note that the web graph is not a complete graph. In a complete graph, every pair of vertices is connected by an edge. However, on the web, not every web page is directly linked to every other page. The web's structure is sparse and decentralized, with some pages having thousands of links, while others have very few.

Characteristics of the Web Graph
  • Scale-Free Nature | The web graph exhibits a scale-free property, meaning that its degree distribution follows a power law. A small number of nodes (web pages) have a very high number of links (high degree), while the vast majority have only a few.
  • Small-World Phenomenon | Despite its vast size, the web is characterized by relatively short path lengths between any two pages, a feature known as the small-world phenomenon. This implies that any page can be reached from any other through a surprisingly small number of steps.
  • Dynamic Structure | The web graph is not static. New pages are constantly being added, old pages are removed, and hyperlinks are continually created and broken. This dynamic nature poses challenges and opportunities for web crawling and search engine optimisation.
Picture
Representing the web as a directed graph is not just a theoretical exercise; it has practical implications in understanding and navigating the complex network of information. This representation forms the basis for search engine algorithms, helps in analysing the structure and growth of the web, and provides insights into how information spreads online. 
Picture
SECTION 2 | WEB GRAPHS AND SUB-GRAPHS
More focused segments of a web-graph are known as sub-graphs. Understanding the distinction between the web graph and its sub-graphs is crucial for grasping the complexity and organisation of online information.

The web graph is a large-scale representation of the entire World Wide Web. A sub-graph is a smaller, more defined portion of the web graph. It typically consists of:
  • A Set of Pages | These are closely related and often revolve around a specific topic, theme, or category.
  • Interconnecting Links | The edges in a sub-graph represent the direct connections between these thematically related pages.
  • Topical Cohesion | Unlike the web graph, a sub-graph is characterized by its thematic consistency. All nodes (pages) in a sub-graph are related to a specific subject or area of interest.
  • Smaller Scale | Sub-graphs are significantly smaller than the entire web graph, making them more manageable and easier to analyse for specific purposes.
  • Use in Specific Analysis | Sub-graphs are particularly useful in targeted studies, such as analysing the spread of information within a community or understanding the structure of a particular sector of the web.

Key Differences between Web graph and a sub-graph
  • Scale and Scope | The web graph is vast and encompasses the entire web, while a sub-graph is a smaller, focused part of the web graph centered around a specific topic.
  • Content Diversity |  The web graph contains a heterogeneous mix of content, whereas a sub-graph is homogeneous in nature, containing pages related to a specific topic.
  • Purpose and Application | The web graph is used for broad analyses of the web’s structure and behaviour, while sub-graphs are ideal for in-depth studies of particular content areas or communities.

While the web graph provides a macroscopic view of the web's vastness and complexity, sub-graphs offer a more focused and detailed examination of specific areas of interest. This understanding is crucial for fields like web analytics, search engine optimization, and academic research, where the structure and nature of web connections play a pivotal role.
SECTION 3 | WEB GRAPH STRUCTURE
The World Wide Web, a vast and intricate network, exhibits a unique and complex structure when viewed as a graph. This structure, emerging organically from the behaviours of countless web users and creators, can be understood through several key features: the bowtie structure, the strongly connected core (SCC), and the concept of diameter. These elements provide insight into the web's architecture and the dynamics of information flow.

The Bowtie Structure of the Web
The web graph can be visualised as having a bowtie structure, a model that effectively captures the web's organization.

Components of the Bowtie
  • IN component | Consists of pages that can reach the SCC but cannot be reached from it.
  • SCC (Strongly Connected Component) | The central part where each page is reachable from every other page in the SCC.
  • OUT component | Contains pages that can be reached from the SCC but do not link back to it.
  • Tendrils: Pages that are not in any of the above three components but are connected to IN or OUT through one-way links.
  • Disconnected components | Pages completely isolated from the main structure.

This model illustrates the web's directional nature and its various levels of connectivity. It highlights how some areas of the web are highly interconnected, while others are more isolated or peripheral.

The Strongly Connected Core (SCC)
The SCC is at the heart of the bowtie structure. It represents a subset of the web where each page is reachable from every other page in the SCC, signifying a robust interconnectivity.

  • High Interlinking | Pages within the SCC often have multiple pathways leading to and from them.
  • Dynamic Nature | The SCC can evolve, reflecting changes in web content and user behaviour.
  • Indicator of Influence | Pages in the SCC tend to be influential or authoritative, given their high connectivity.

The Diameter of the Web Graph
The diameter of a graph is the longest of all the shortest paths between any pair of nodes. In the context of the web graph:
  • Represents the 'Degrees of Separation' | It indicates the maximum number of steps required to navigate from one page to any other page in the web graph.
  • Implications for Web Navigation | A smaller diameter suggests that information can spread more quickly and efficiently across the web.
LONGEST OF ALL SHORTEST
The term "longest of all the shortest paths between any pair of nodes" refers to how the diameter of a graph is calculated. Let’s break this down:
Key Concepts:
  1. Node: In the context of a web graph, a node represents a webpage.
  2. Path: A path is a sequence of edges (links) that connects two nodes (webpages).
  3. Shortest Path: The shortest path between two nodes is the minimum number of edges (links) you need to traverse to go from one node to the other.
  4. Diameter: The diameter of the graph is the length of the longest shortest path between any two nodes in the graph.
Explanation:
  • Imagine all the webpages in the web graph are interconnected by links. Some webpages are close to each other (require fewer links to connect), while others are farther apart (require more links).
  • For every pair of webpages, find the shortest possible path that connects them.
  • Among all these shortest paths, identify the one that is the longest. This is the diameter of the graph.
Analogy:Think of a city map where intersections are nodes and roads are edges. The shortest path is like finding the quickest way to drive between two intersections. The diameter would be the longest "quickest route" between any two intersections in the entire city.
In Context of Web Graph:
  • The diameter represents the maximum number of "clicks" needed to navigate between the two most distant webpages in the graph.
  • A smaller diameter implies that most webpages are closely connected, making information easier and faster to access. A larger diameter indicates that there are webpages that are far apart, requiring many clicks to reach.
In summary, the diameter gives a sense of the overall "reachability" and efficiency of the network.

The longest of all the shortest paths is the diameter of the graph. To understand this, let’s break it down:
  1. Shortest Path: For any two nodes (webpages) in the graph, the shortest path is the fewest edges (links) needed to travel between them.
  2. All Shortest Paths: If you calculate the shortest path for every possible pair of nodes in the graph, you get a collection of shortest paths.
  3. Longest of All Shortest Paths: Among this collection of shortest paths, the longest one (the path with the most edges among the shortest paths) is called the diameter.
Example:Imagine a simple graph:
  • Node A connects to Node B directly (1 edge).
  • Node B connects to Node C directly (1 edge).
  • Node A connects to Node C through B (2 edges).
Here are the shortest paths between each pair:
  • A → B: 1 edge
  • B → C: 1 edge
  • A → C: 2 edges (via B)
The longest shortest path is 2 edges, so the diameter of this graph is 2.
Longest Shortest Path in a Web Graph:In the context of a web graph:
  • If you calculate the shortest path between every pair of webpages, the longest among these represents the farthest "reachable" relationship in the graph.
  • For instance, if the longest shortest path between any two webpages is 6 clicks, the diameter of the web graph is 6. This means it takes a maximum of 6 links to navigate between the most distant pair of pages.

​Difference Between "Longest Path" and "Longest of All Shortest Paths":
  1. Longest Path:
    • The longest path in a graph considers all possible paths, even those that are not the shortest.
    • It might include loops or inefficient routes between nodes.
    • This is not relevant for the concept of diameter because diameter focuses on efficient connectivity, not all possible routes.
  2. Longest of All Shortest Paths:
    • This focuses on the shortest possible paths between each pair of nodes.
    • Among all these shortest paths, the longest one is taken as the diameter.
    • It represents the "worst-case scenario" for the minimum steps needed to connect the most distant nodes efficiently.

Small-World Phenomenon
Despite its vast size, the web often exhibits a surprisingly small diameter, indicating that any page is relatively close to any other, at least in terms of hyperlink steps.

Emergent Structure from User Behaviour
The structure of the web graph is not the result of a centralised design but emerges organically from the collective actions of web users and content creators. This decentralised evolution leads to the complex, dynamic nature of the web, making it a subject of continuous study in fields like network theory, computer science, and information science.

Understanding the structure of the web graph is essential for grasping how information is organized and disseminated on the internet. The bowtie model, the concept of the SCC, and the diameter of the web graph are key features that reveal the underlying patterns and connections shaping this digital landscape. As we continue to contribute to and interact with the web, these structures will evolve, reflecting the ever-changing nature of online information and human behaviour.
Picture
Diagram Labels and Descriptions for the Bowtie Structure illustrated above.
​
  •  IN | This section represents web pages that can link to the SCC (Strongly Connected Component) but cannot be reached directly from it. These are typically pages that provide information or links leading into the core of the web but are not as interconnected as those in the SCC.
  • SCC | At the center of the bowtie, the SCC is the heart of the web graph. It consists of web pages that are highly interconnected, with each page being able to reach every other page in the SCC. This core represents the most 'central' part of the web, often containing the most authoritative and linked-to pages.
  • OUT | This segment includes pages that can be reached from the SCC but do not link back to it. These might be pages that aggregate or display information sourced from the core but do not contribute back to the interconnectedness of the SCC.
  • Tendrils | Tendrils are pages that are not directly connected to the SCC. They either link to or are linked from either the IN or OUT components but are not part of the central structure. Tendrils represent the more peripheral parts of the web, often containing specialised or less popular content.
  • Tubes | Tubes are direct connections between the IN and OUT components that bypass the SCC. These are less common but signify alternate pathways in the web graph, connecting the incoming and outgoing sections without interacting with the core SCC. 
  • Disconnected components | These are web pages or clusters of pages that are not connected to any other part of the main web graph. They stand alone and are isolated from the main interconnected structure of the web.
SECTION 4 | GRAPH THEORY AND CONNECTIVITY
Graph theory, a fundamental area of mathematics and computer science, plays a crucial role in understanding and analysing the connectivity of the World Wide Web. By applying the principles of graph theory, we can gain insights into how web pages are interconnected, how information flows, and how robust the web is in terms of connectivity.

Basics of Graph Theory
Graph theory is the study of graphs, which are mathematical structures used to model pairwise relations between objects. A graph is made up of vertices (or nodes) connected by edges. In the context of the web:
  • Vertices|  Represent web pages.
  • Edges | Symbolise hyperlinks between pages.

Key Concepts in Graph Theory
  • Paths and Cycles | A path in a graph is a sequence of edges that connects a sequence of vertices. A cycle is a path that starts and ends at the same vertex.
  • Degree of a Vertex | The number of edges connected to a vertex. In web terms, this can be seen as the number of direct links a web page has.
  • Subgraphs | Portions of a graph that constitute a graph themselves, relevant in understanding specific sections of the web.

Graph Theory in Analysing Web Connectivity
  • Connectivity in Graph Theory | Refers to the degree to which vertices (web pages) are connected with each other.
  • Components of Connectivity | In the web graph, connectivity can be understood in terms of reachable paths from one page to another, the existence of isolated subgraphs, and the overall interlinking of pages.

Role of Graph Theory in Web Connectivity
  • Understanding Web Structure | Graph theory helps in visualising and understanding the complex structure of the web. It allows us to see how pages are interlinked, forming structures like the bowtie model.
  • Analysing Link Patterns | By studying the edges and their directions in the web graph, graph theory aids in understanding how information flows across the web.
  • Identifying Key Nodes | Graph theory is used to identify important nodes in the web graph, such as hubs (pages with many outgoing links) and authorities (pages with many incoming links), which are crucial in search engine algorithms.
  • Evaluating Robustness | Graph theory allows for the evaluation of the web’s robustness, assessing how the web would be affected by the removal of certain nodes or edges (e.g., how the removal of a major website might impact overall connectivity).
  • Network Analysis | Advanced graph theory techniques enable the analysis of the web as a network, including studying its scale-free nature and small-world properties.

Graph theory provides a powerful framework for understanding the connectivity of the World Wide Web. It offers tools and concepts that are essential for analysing the web’s structure, understanding its dynamics, and even improving its functionality through better network design and search engine algorithms. As the web continues to grow and evolve, the role of graph theory in deciphering its complexity becomes increasingly important.
SECTION 5 | SEARCH ENGINES AND WEB CRAWLING
Search engines have become the primary means by which users navigate the vast expanse of the World Wide Web. Central to the functionality of these search engines is the process of web crawling, which utilises the web graph to access and index information. A key component in this process is the PageRank algorithm, a method developed by Google's founders to rank web pages based on their importance.

Web crawling is the process by which search engines systematically browse the web to collect information from web pages. This process involves:
  • Navigating the Web Graph | Crawlers start from a set of known web pages and follow hyperlinks to discover new pages, effectively traversing the web graph.
  • Indexing Content | As they crawl, these bots index the content of web pages, making it retrievable by the search engine.

Search engines use the data gathered by web crawlers to create a searchable index of the web. This index is essentially a map of the web graph, structured in a way that allows the search engine to quickly find and retrieve relevant web pages in response to user queries.

The Concept of PageRank
PageRank is an algorithm used by Google to rank web pages in their search engine results. It is based on the idea that the importance of a web page can be determined by the number of links pointing to it, as well as the quality of these links.

How PageRank Works
  • Link Analysis | PageRank views links as votes, where a page linking to another page is seen as casting a vote for that page. The more votes (links) a page receives, the more important it is deemed to be.
  • Quality of Links | Not all votes are equal. A vote (link) from a page that is itself important (has many incoming links) carries more weight.
  • Iterative Process | The algorithm assigns each page a rank (a probability distribution) based on the number and quality of incoming links. This process iterates multiple times, refining the ranks with each pass through the data.

Key Points of PageRank
  • Democratic Nature | PageRank operates on the democratic principle where every page can vote on the importance of other pages.
  • Prevention of Manipulation | The algorithm is designed to prevent manipulation by not counting repeated links from the same page or links from pages with no relevance.
  • Importance Beyond Page Count | A page with fewer but higher-quality links can rank higher than a page with numerous lower-quality links.

Search engines and web crawling are integral to how we access and make sense of the vast information on the web. The use of the web graph in these processes is crucial, allowing for efficient navigation and indexing of web content. The PageRank algorithm stands out as a pioneering approach in this domain, using the principles of graph theory to assess the importance of web pages. Understanding these concepts is key to comprehending how information is organised and retrieved in the digital age.
​SECTION 6 | WEB DEVELOPMENT PREDICTIONS ​
Understanding and predicting the growth and evolution of the World Wide Web is a topic of significant interest. One approach to making such predictions is through the lens of power laws, a type of mathematical relationship often observed in various natural and social phenomena, including aspects of the web. This section discusses the appropriateness and limitations of using power laws to predict the development of the web.

What are Power Laws?
Power laws are mathematical relationships where one quantity varies as a power of another. In the context of the web, this often relates to the distribution of certain web properties, such as the number of links to web pages.

Power Laws in Web Development
  • Examples | A classic example is the distribution of links to web pages; a small number of pages (like popular social media platforms or news sites) have a disproportionately large number of links compared to most other pages.
  • Scale-Free Networks | The web is often described as a scale-free network, a type of network characterized by the power-law distribution of connections per node. This implies that a few nodes (web pages) have many connections (links), while the vast majority have few.

Are Power Laws Appropriate for Predicting Web Development?
  • Historical Accuracy | Historically, power laws have accurately described certain aspects of the web's growth, particularly in link distribution and network connectivity.
  • Simplicity and Scalability | Power law models are relatively simple and scalable, making them useful for analyzing large-scale web data.
  • Insight into Network Dynamics | They provide insights into the fundamental dynamics of web development, such as the tendency for popular nodes to attract more links (the "rich get richer" phenomenon).

Limitations and Challenges
  • Over-Simplification | Relying solely on power laws can oversimplify the complex and multifaceted nature of web growth, which is influenced by technological, social, and economic factors.
  • Predictive Uncertainty | The web is a dynamic and evolving entity. Power laws, while descriptive of past and current trends, may not account for future technological innovations or shifts in user behavior.
  • Changing Algorithms and Policies | The algorithms of search engines and the policies of major web platforms can significantly influence web structure, potentially disrupting power-law distributions.
  • Emergence of New Patterns | As the web matures, new patterns of growth and connectivity that don't necessarily follow power laws may emerge.

While power laws provide a useful framework for understanding certain aspects of the web's structure and growth, they should be used with caution in predicting its future development. The web is influenced by a myriad of factors that can lead to deviations from power-law behaviour. Therefore, a more holistic approach, combining power laws with other predictive models and considering a range of social, technological, and economic factors, is likely to yield more accurate and comprehensive predictions about the future of web development.
REVIEW QUESTIONS
  1. Define a Directed Graph.
  2. What does each vertex represent in the context of the web graph?
  3. Explain the term 'Sub-Graph' in the context of web graphs.
  4. Describe the Strongly Connected Component (SCC) in a web graph.
  5. What is the significance of the 'Diameter' in graph theory?
  6. How does the PageRank algorithm determine the importance of a web page?
  7. What is the role of web crawling in the context of search engines?
  8. Explain what a 'Scale-Free Network' is and how it relates to the web.
  9. Describe the 'IN Component' in the bowtie structure of the web graph.
  10. What challenges arise when using power laws to predict the development of the web?
Picture
SUGGESTIONS
We would love to hear from you
SUBSCRIBE 
To enjoy more benefits
We hope you find this site useful. If you notice any errors or would like to contribute material then please contact us.